After the Selloff, Here's the Lowdown on the Lows
Here's what I'll be watching now and what it will take to turn things around. Plus, a look at Alphabet, Mastercard, the Utes and more.
You've reached your free article limit
You've read 0 of 1 free Pro articles.
The Market
Did the market jump the gun and start heading down from the overbought reading a day or so early? It is very possible. It is also possible this was just a last-day-of-the-month-type selloff.
Whatever it is should Fed Chair Powell say something the market likes Wednesday and we rally, it won’t change the fact that it would still be helpful for the market to come back down to get the intermediate-term indicators oversold.
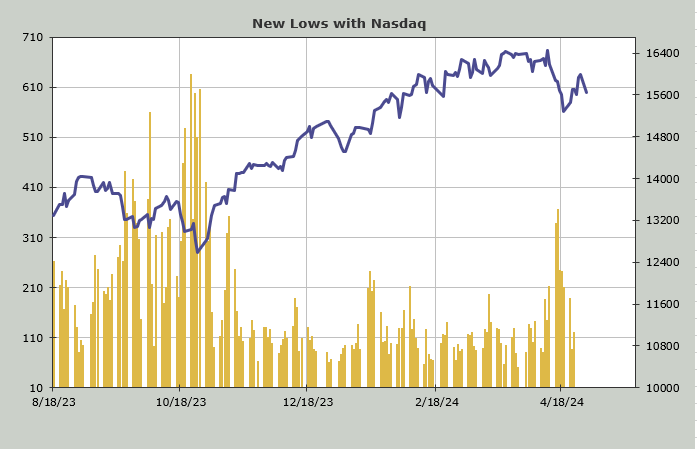
Let me note what I will be watching. The number of stocks making new lows. There was a modest increase Tuesday on the Nasdaq (NYSE too). That reading of 366 new lows on April 16 is the peak reading thus far. You do not want to see that expand.
However, in order to get the NYSE Hi-Lo Indicator to an oversold reading we are going to need to see some more downside. It currently stands in the 0.50s and it doesn’t get fully oversold until it slips under 0.20.
The Volume Indicator got to 0.48. Maybe I should not split hairs waiting for it to get to 0.47 or under.
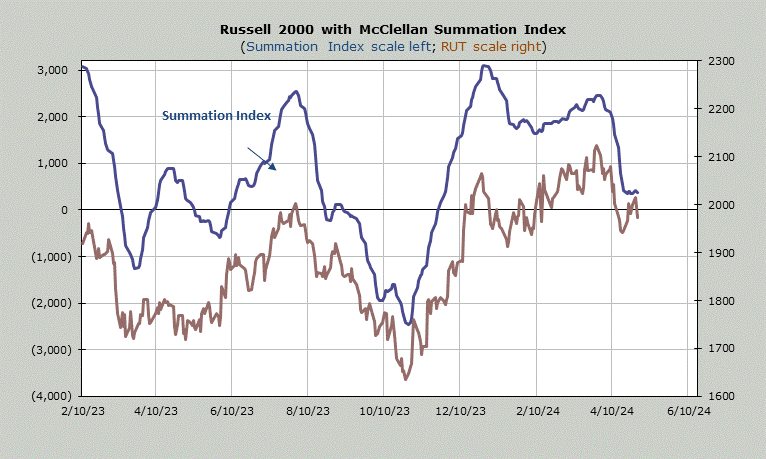
Then there is the McClellan Summation Index. It won’t take much to turn it upward. The NYSE needs a net differential of +800 advancers minus decliners on the NYSE to halt the decline and therefore more to turn it upward. Recall that at the lows a few weeks ago that reading was nearly +5,000 so we’ve come a long way.
Note that the rally did not turn the indicator upward but rather just halted the decline. Typically when it gets this close to the zero line it will slip under it before the move is done. But the bearish side of the equation is that it did not lift with the market. The bullish side is that it won’t take much to turn it upward. The chart is below.
Sentiment is already getting bearish as we discussed yesterday so an overbought pullback ought to get some of those sentiment readings to an extreme.
New Ideas
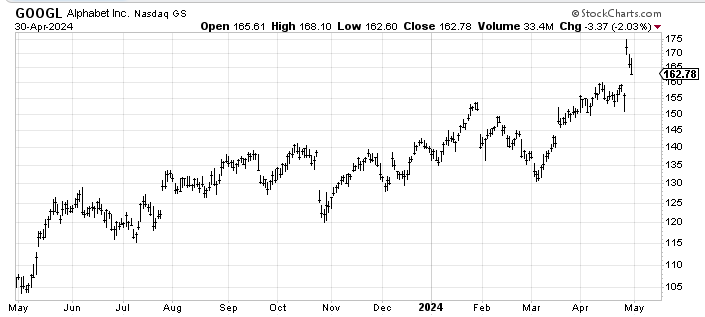
This is just a reminder that the measured target on Alphabet (GOOGL) was around $170 and it got there last week. I would expect it to fill that gap and then rally again but for the time being I think the stock has mostly done all it can do. Gaps up have tended to have little follow through.
Today’s Indicator
The McClellan Summation Index is discussed in full above.
Q&A/Reader’s Feedback
Helene welcomes your questions about Top Stocks and her charting strategy and techniques. Please send an email directly to Helene with your questions. However, please remember that TheStreet.com Top Stocks is not intended to provide personalized investment advice. Email Helene here.
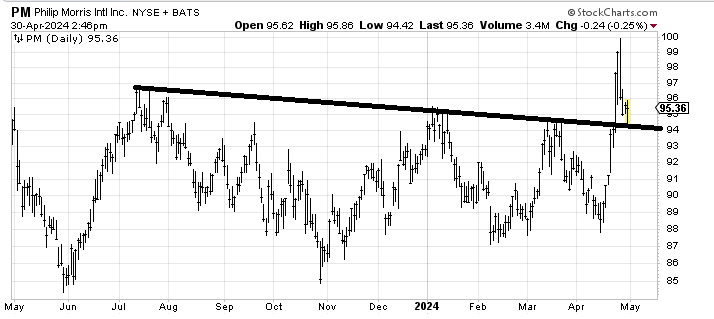
Philip Morris International PM has had a nice pullback to support (the breakout) and so this is the area to buy it again.
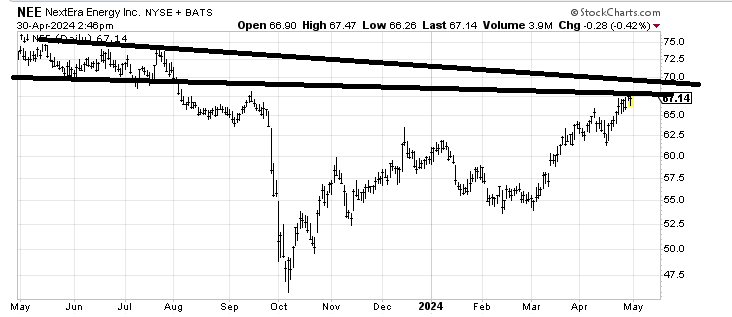
NextEra Energy NEE is pushing up against some resistance as well as a short-term measured target. I still like the Utes longer term but right here, if I were trading NEE I would take something off the table. The real question is where to buy it again and my sense is in the $62-65 area but I’d rather see a pattern shape up.
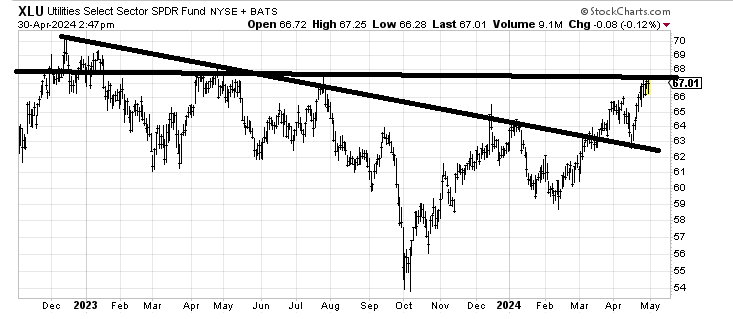
Again, we know I like the Utes and the Utilities Select Sector SPDR Fund XLU is no exception but it is going to take some chewing through resistance to get over this $68-70 area. I would like to see a pop over $68-ish and then a retest of the flat line because that would be a bullish pattern.
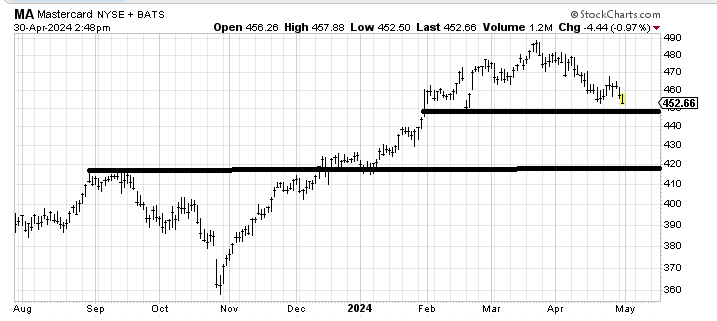
Mastercard MA measured to $480 from the breakout over $420. It now looks as though it is building a top. What would get me bullish on it would be holding over $450 to develop a pattern or a plunge to $420. Right here, it hasn’t broken yet so it’s in nowhere-land. I prefer a plunge to $420, but then I always prefer a plunge.